6 in 10 Indians surveyed reduced their Made in China purchases in 2022 given the geopolitical situation
- ● Dip in demand of Chinese made fashion, apparel and vehicle accessories amongst Indians
- ● 1 in 4 surveyed found “Indian alternatives” better in price, quality and customer service
- ● 1 in 3 Indians surveyed however still using Made in China gadgets
- ● 59% Indians surveyed do not have any Chinese app on their phone while 29% still have 1 or more

December 16, 2022, New Delhi: Will the latest skirmish between India and China at the along the Arunachal Pradesh LAC on December 9th, reportedly resulting in injuries on both sides, have a fallout on buying Made-in-China products? Post the border clash in 2020 in which 20 Indian soldiers were killed there was a rising sentiment to boycott Chinese products and instead push ahead with promoting Indian manufacturing under the “Atmanirbhar Bharat” banner. As seen during festive shopping this year, there has been some shift, albeit only in a few sectors like apparel and vehicle accessories where quality instead of price has been a deciding factor.
However, the continuing demand for Chinese products, mobile phones and mobile apps despite the government ban on many of them raises questions on why citizens are continuing to do so. In a new survey, LocalCircles attempted to understand the pulse of the citizens regarding Chinese products and services including use of Chinese apps. The survey received over 40,000 responses from consumers located in 319 districts of India. 63% respondents were men while 37% respondents were women. 42% respondents were from tier 1, 34% from tier 2 and 24% respondents were from tier 3, 4 and rural districts.
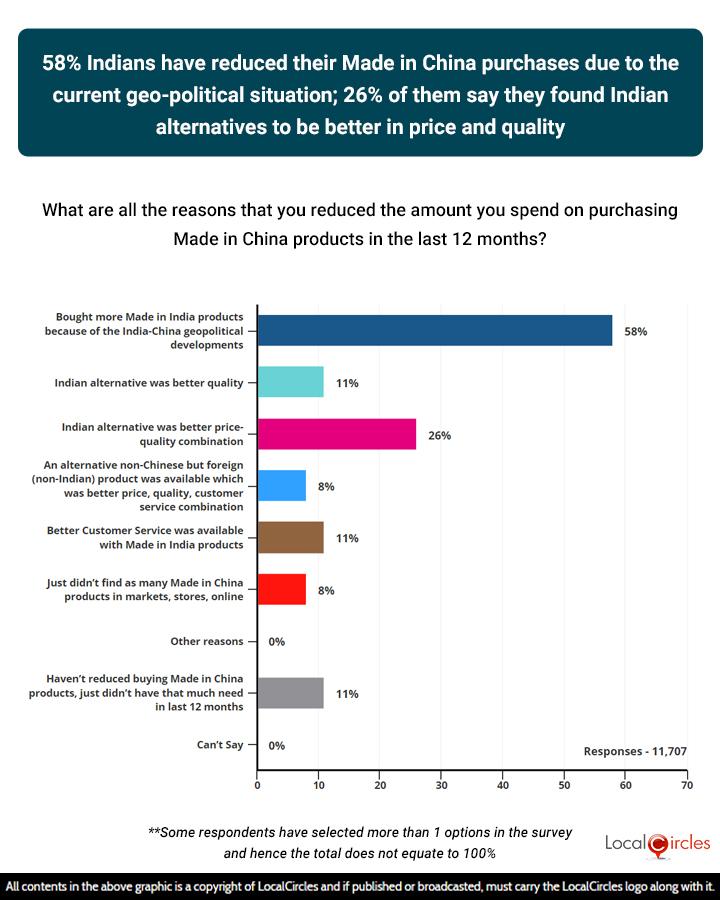
58% Indians have reduced their Made in China purchases due to the current geo- political situation; 26% of them say they found Indian alternatives to be better in price and quality
The first question in the survey attempted to understand if consumers have reduced spending on Made in China products and if so, why. It asked them “What are all the reasons that you reduced the amount you spend on purchasing Made in China products in the last 12 months?” In response, 58% revealed they bought “Made in India products because of the India-China geopolitical developments”, 28% found “Indian alternative was better in price- quality combination as also customer service, 11% opted for better quality Indian products, 8% preferred an alternative foreign product due to a combination of factors including better price, quality and customer service. In addition, 8% stated that their choice was determined by the fact that they “didn’t find many Made in China products in the markets, stores or online”. For 11% of consumers, the lack of need to buy any product in the last one year was a deciding factor. Of the 11,707 respondents to this question, many opted for more than one category of answers.

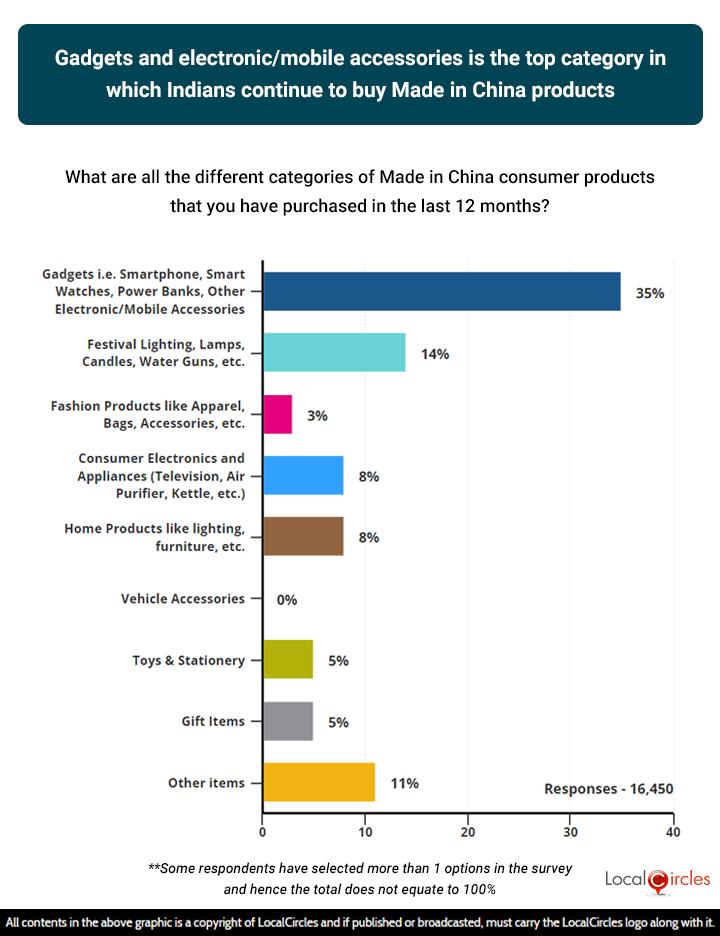
35% shared gadgets and electronic goods and accessories as the top category of Chinese products they bought in the last 12 months followed by 14% indicating festive celebration articles like lightings, lamps, etc.
The next question in the survey focused on the kind of Made in China products Indians were still buying and what they were buying less of. It asked respondents, “What are all the different categories of Made in China consumer product that you purchased in the last 12 months?”. In response, the largest segment of 35% shared gadgets and electronic goods and accessories as the top category, 14% listed festive celebration articles like lightings, lamps, etc., 8% had shopped for consumer electronic products and another 8% home furnishing products. With health concerns over quality of paints and other material used, Chinese toys and stationery were purchased by only 5% as well as Chinese gift articles also finding favour with 5% respondents and their families. In addition, 11% admitted to buying other Chinese products. Out of 16,450 respondents to this question, many admitted to have bought more than one category of Chinese products.

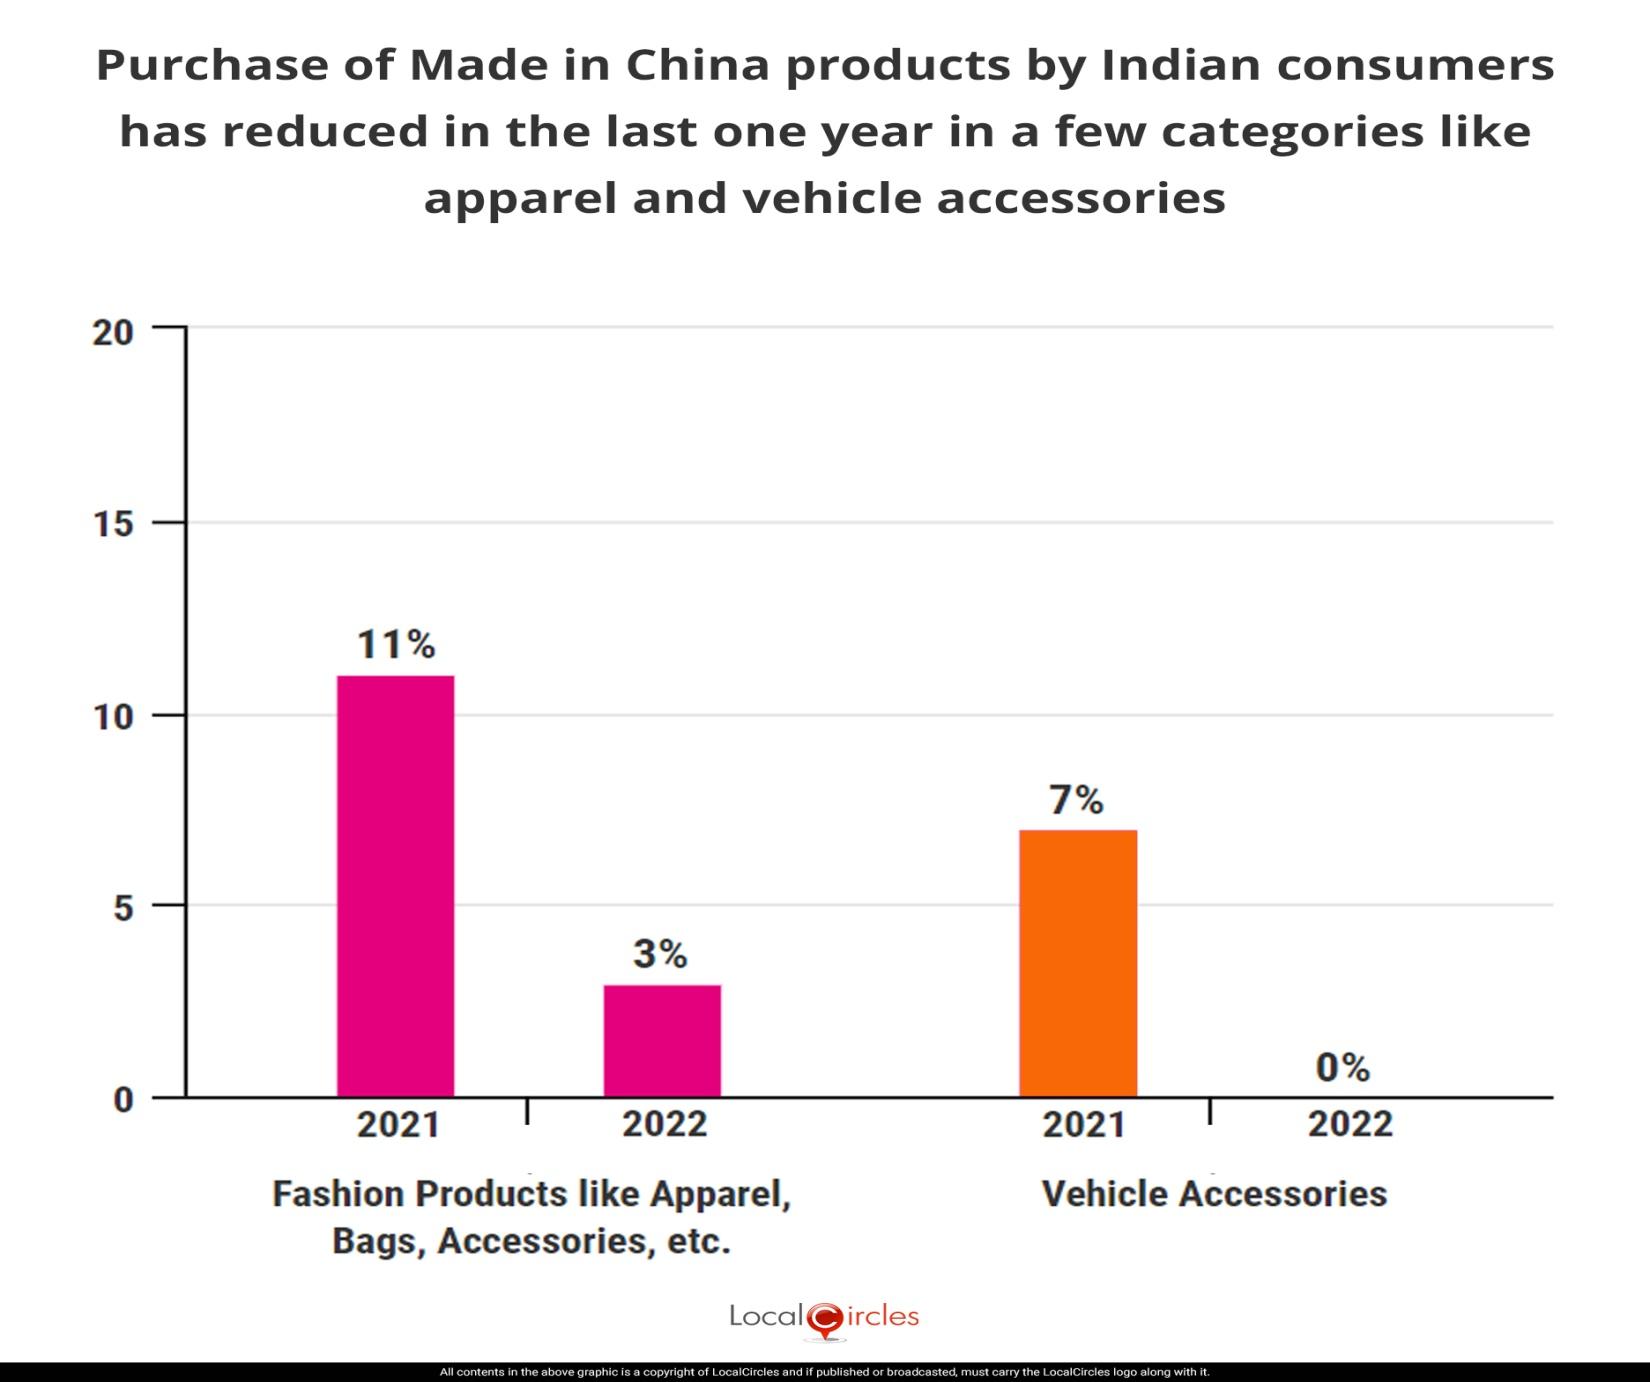
As against 11% admitting to buying Chinese fashion products in 2021, the 2022 survey found only 3% are buying ‘Made in China’ bags, apparels, accessories, etc.
As against 11% admitting to buying Chinese fashion products in 2021, the 2022 LocalCircles survey found only 3% are buying Made in China bags, apparels, accessories, etc. In the vehicle accessories category, from 7% this time none of the respondents admitted to having bought any vehicle accessory manufactured in China so far this year.


Despite some blips, the year-on-year demand for Made in China gadgets has risen from 29% to 35% according to the LocalCircles survey in 2021 and now. Similarly, festive celebration products demand has risen from 11% to 14%. There has been a marginal 1% increase in consumer electronics and white goods demand from 7% to 8%, in toys and stationery from 4% to 5%, and a similar growth in the gift items imported from China.
The rising realization that Indian made quality products and after sale services are very competitive to products from China is still to gain firm footing as the trade deficit between India and China is widening. It has touched USD 51.5 billion during April-October so far this fiscal as against USD 73.31 billion during 2021-22 fiscal year and 44.03 billion in 2020-21, according to the data provided by Commerce and Industry minister Piyush Goyal in a written reply to the Rajya Sabha. India’s imports during April-October this fiscal stood at USD 60.27 billion, while exports aggregated USD 8.77 billion. Most of the goods imported from China are capital goods, intermediate goods and raw materials and are used for meeting the demand of fast-expanding sectors like electronics, telecom and power in India, Goyal stated.
Other imports from China are animal or vegetable fats; ores, slag and ash; mineral fuels, inorganic chemicals, organic chemicals, fertilizers, tanning or dyeing extracts, miscellaneous chemical products, plastic and articles, paper and paperboard, cotton, textile fabrics, footwear, glass and glassware, iron and steel, copper, furniture, among others, government data shows.
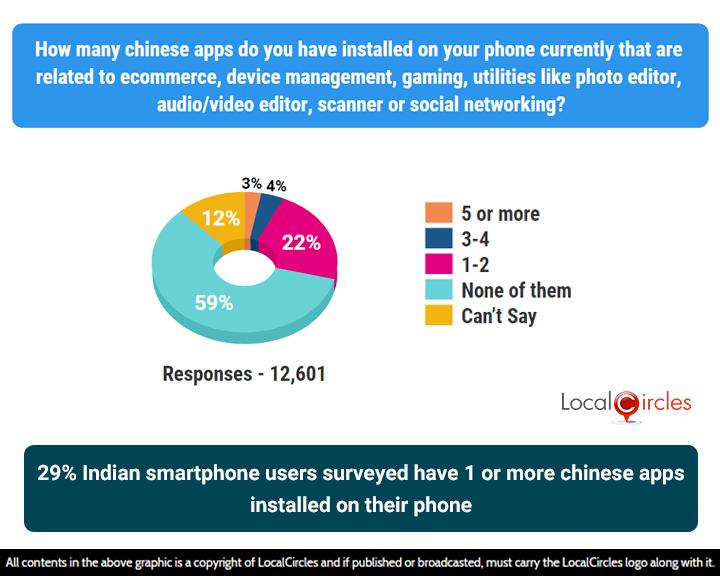
29% Indian smartphone users surveyed still have one or two Chinese apps on their mobile phone though a majority 59% have none
An area of continuing concern is that despite the government warning people from time to time about the data security risk of using Chinese apps, many of them continue to enjoy huge popularity particularly among the young mobile users. In June 2020, India took down TikTok and 59 other applications. A month later, mirror applications were taken down as they were functioning despite the ban. In September 2020, the government banned 118 more mobile applications, including gaming platform PUBG, for “stealing and surreptitiously transmitting users data in an unauthorized manner”. In February this year India banned 54 more Chinese apps over privacy, security and espionage concerns claiming that they were clones of previously banned applications. The 54 banned apps including Beauty Camera, Equalizer, Music Player, Rise of Kingdoms: Lost Crusade, Tencent Xriver, and Conqueror Online II are alleged to misuse and transmit real-time data to servers located in a hostile country, the electronics and information technology ministry said in a statement announcing the decision. Post an extensive study by LocalCircles earlier this year on the menace of instant loan apps, primarily run by Chinese entities in India, the Reserve Bank of India (RBI) this year tightened norms for use of digital loan apps.
To quantify the usage of Chinese mobile apps, the LocalCircles’ survey asked respondents, “How many Chinese apps do you have installed on your phone currently that are related to ecommerce, device management, gaming, utilities like photo editor, audio/video editor, scanner or social networking?” Out of 12,601 respondents, 29% of respondents admitted to having one or more apps. Breakdown of data shows 22% have one or two Chinese apps on their mobile phone, 4% have 3 to 4 apps and another 3% have five or more apps. However, a big majority of 59% are not using any Chinese apps while 12% are not sure if they are using any Chinese apps.

Is the tide shifting in favour of India’s manufacturing and manpower capability? Taiwan based Foxconn, which has its largest iPhone plant in China, has recently lowered its forecast of premium iPhone 14 models shipment from that country, even as the company is reported to be sizably increasing its workforce at its plant in India. This reflects well both on the Indian government’s push to boost manufacturing and market demand within the country for quality products.
In summary, the current geo-political equation between the two countries and the Galwan valley clash in June 2020 and the faceoff a few days ago along Arunachal Pradesh Line of Control, is likely to lead to more Indians staying away from Made in China products. This is evident with the survey finding where 6 in 10 Indians surveyed have confirmed that they have reduced their purchases of Made in China products. In categories like fashion and apparel and vehicle accessories this is evident in the survey. However, purchases of Made in China gadgets by Indians continue and is an area where India must find a way so people purchase their Made in India counterparts. Given that Chinese imports are growing, a lot of imports seem to be business to business versus business to consumer. This needs to be addressed as well. Many Indian businesses who are currently importing and assembling must consider producing in India instead and the Government may want to consider incentivising manufacturing. It should also consider dis-incentivising import and sales in sectors where there is already several Make in India entities and imported Chinese goods are just added competition. The good news is 1 in 4 Indians already believe that Made in India products offer a better price-quality combination than Made in China. As India invites corporations, both multinational and Indians to make in India or make much more in India, it must do all possible for businesses so they can set up, operate and produce as efficiently as possible as quickly. For once, they have readily available demand and a positive Made in India citizen sentiment going for them.
Survey Demographics
The survey received over 40,000 responses from consumers located in 319 districts of India. 63% respondents were men while 37% respondents were women. 42% respondents were from tier 1, 34% from tier 2 and 24% respondents were from tier 3, 4 and rural districts. The survey was conducted via LocalCircles platform and all participants were validated citizens who had to be registered with LocalCircles to participate in this survey.
About LocalCircles
LocalCircles, India’s leading Community Social Media platform enables citizens and small businesses to escalate issues for policy and enforcement interventions and enables Government to make policies that are citizen and small business centric. LocalCircles is also India’s # 1 pollster on issues of governance, public and consumer interest. More about LocalCircles can be found on https://www.localcircles.com
For more queries - media@localcircles.com, +91-8585909866
All content in this report is a copyright of LocalCircles. Any reproduction or redistribution of the graphics or the data therein requires the LocalCircles logo to be carried along with it. In case any violation is observed LocalCircles reserves the right to take legal action.
Enter your email & mobile number and we will send you the instructions.
Note - The email can sometime gets delivered to the spam folder, so the instruction will be send to your mobile as well


